
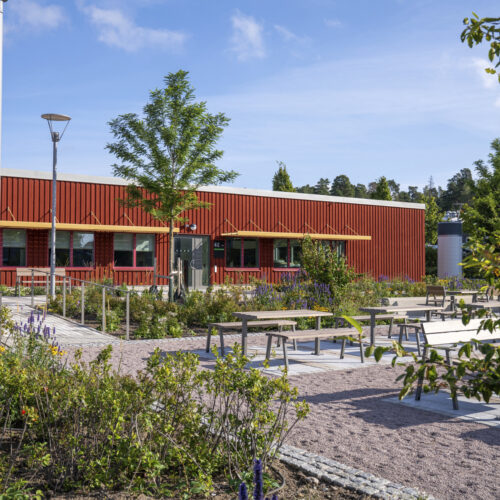
We work towards a more sustainable and prosperous region
We disclose estimated impact on all our signed loans, and report on the aggregated impact for different project categories. NIB’s investment portfolio is built on sound ESG performance. We also manage our own footprint to ensure low carbon operations.
Sustainable financing
Our mission addresses the needs of the Nordic-Baltic region to foster sustainable growth. NIB’s major impact comes from its long-term lending to projects. Before financing is granted, NIB assesses how the projects fulfil our mandate. In addition, all loan projects undergo a sustainability and ESG review. After a project is completed, our analysts follow up on the impact achieved.
To improve productivity, NIB-financed projects focus on:
technical progress and innovation;
human capital and equal economic opportunities;
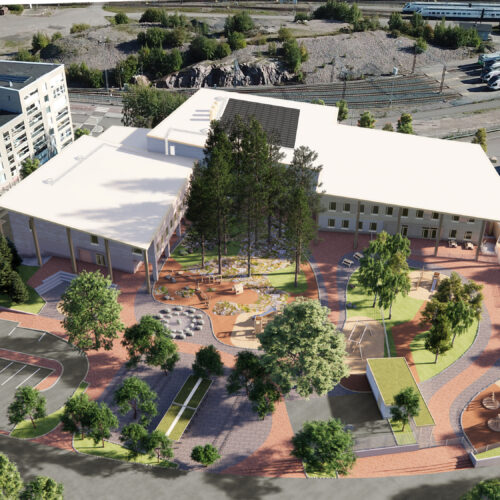
improvements in infrastructure;
market efficiency and business environment.
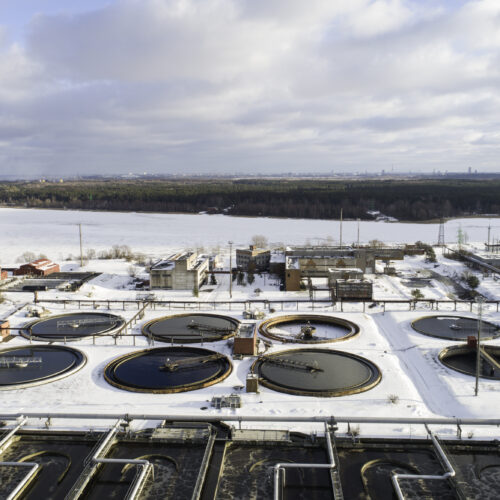
To benefit the environment, NIB targets projects that foster:
pollution prevention;
preventive measures;
resource efficiency;
development of clean technology;
climate change mitigation.
Disclosure
Our guiding principles are accountability, clarity, efficiency, transparency, and interaction with stakeholders. NIB discloses information on all our loan projects, investments in labelled bonds, funding transactions and their impact, as well as our ESG ratings. We collect stakeholder feedback on Category A projects with potentially extensive social and environmental impacts.

Signed loans
We publish project summaries of our signed loans. They include information on the financed investments’ impact on productivity and environment.
NEB-funded projects
We provide our investors with an overview and detailed data of the projects financed from the proceeds of NIB Environmental Bonds.

SLLB-funded loans
We publish an annual report on the SLL Eligible Portfolio, including KPI performance and progress towards targets.
News & media
We are accountable to our member countries and to society as a whole, thus we inform different stakeholder groups about our activities.

ESG library
We are committed to continuously developing and reporting our operations’ environmental, social and governance factors.
Category A projects for public disclosure
Projects with potentially extensive social and environmental impacts are made publicly available for comment before the Bank decides on financing the project. Project summaries are available on this website for a period of 30 days. Only after this public consultation will NIB’s Board of Directors makes a decision on the project.
Your feedback is important to us!
Please send your comments to info@nib.int with “Category A project” in the subject field.
Impact of loans disbursed
We use a comprehensive methodology to measure, evaluate, and report the impacts generated through our financing activities. Our impact assessment process spans the entire project lifecycle, from the initial implementation through the completion. We disclose the impact of our disbursed financing (pro-rated to NIB’s share of total project costs) in our annual reports.
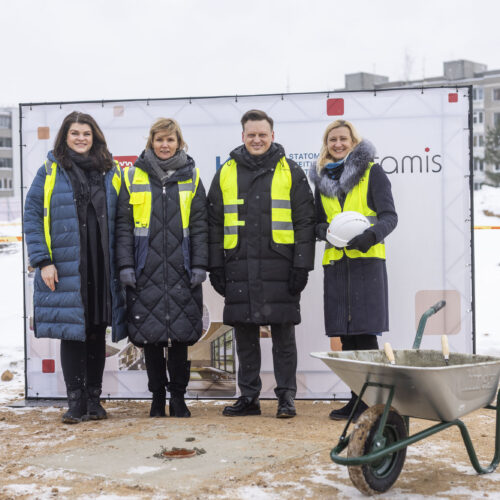
Latest loans


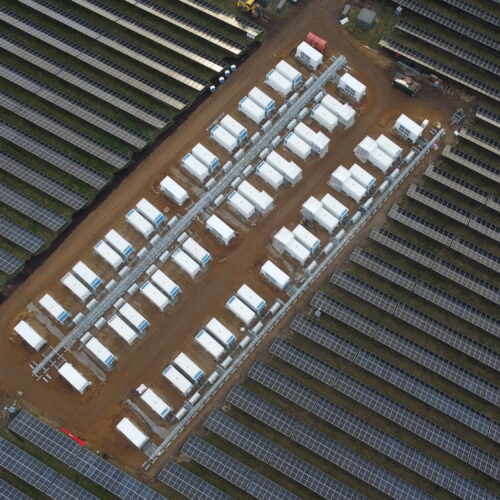


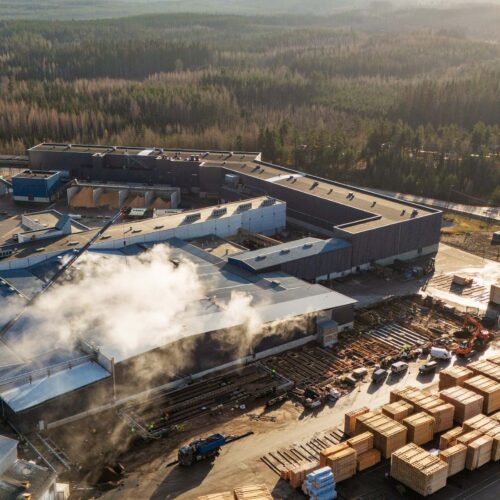


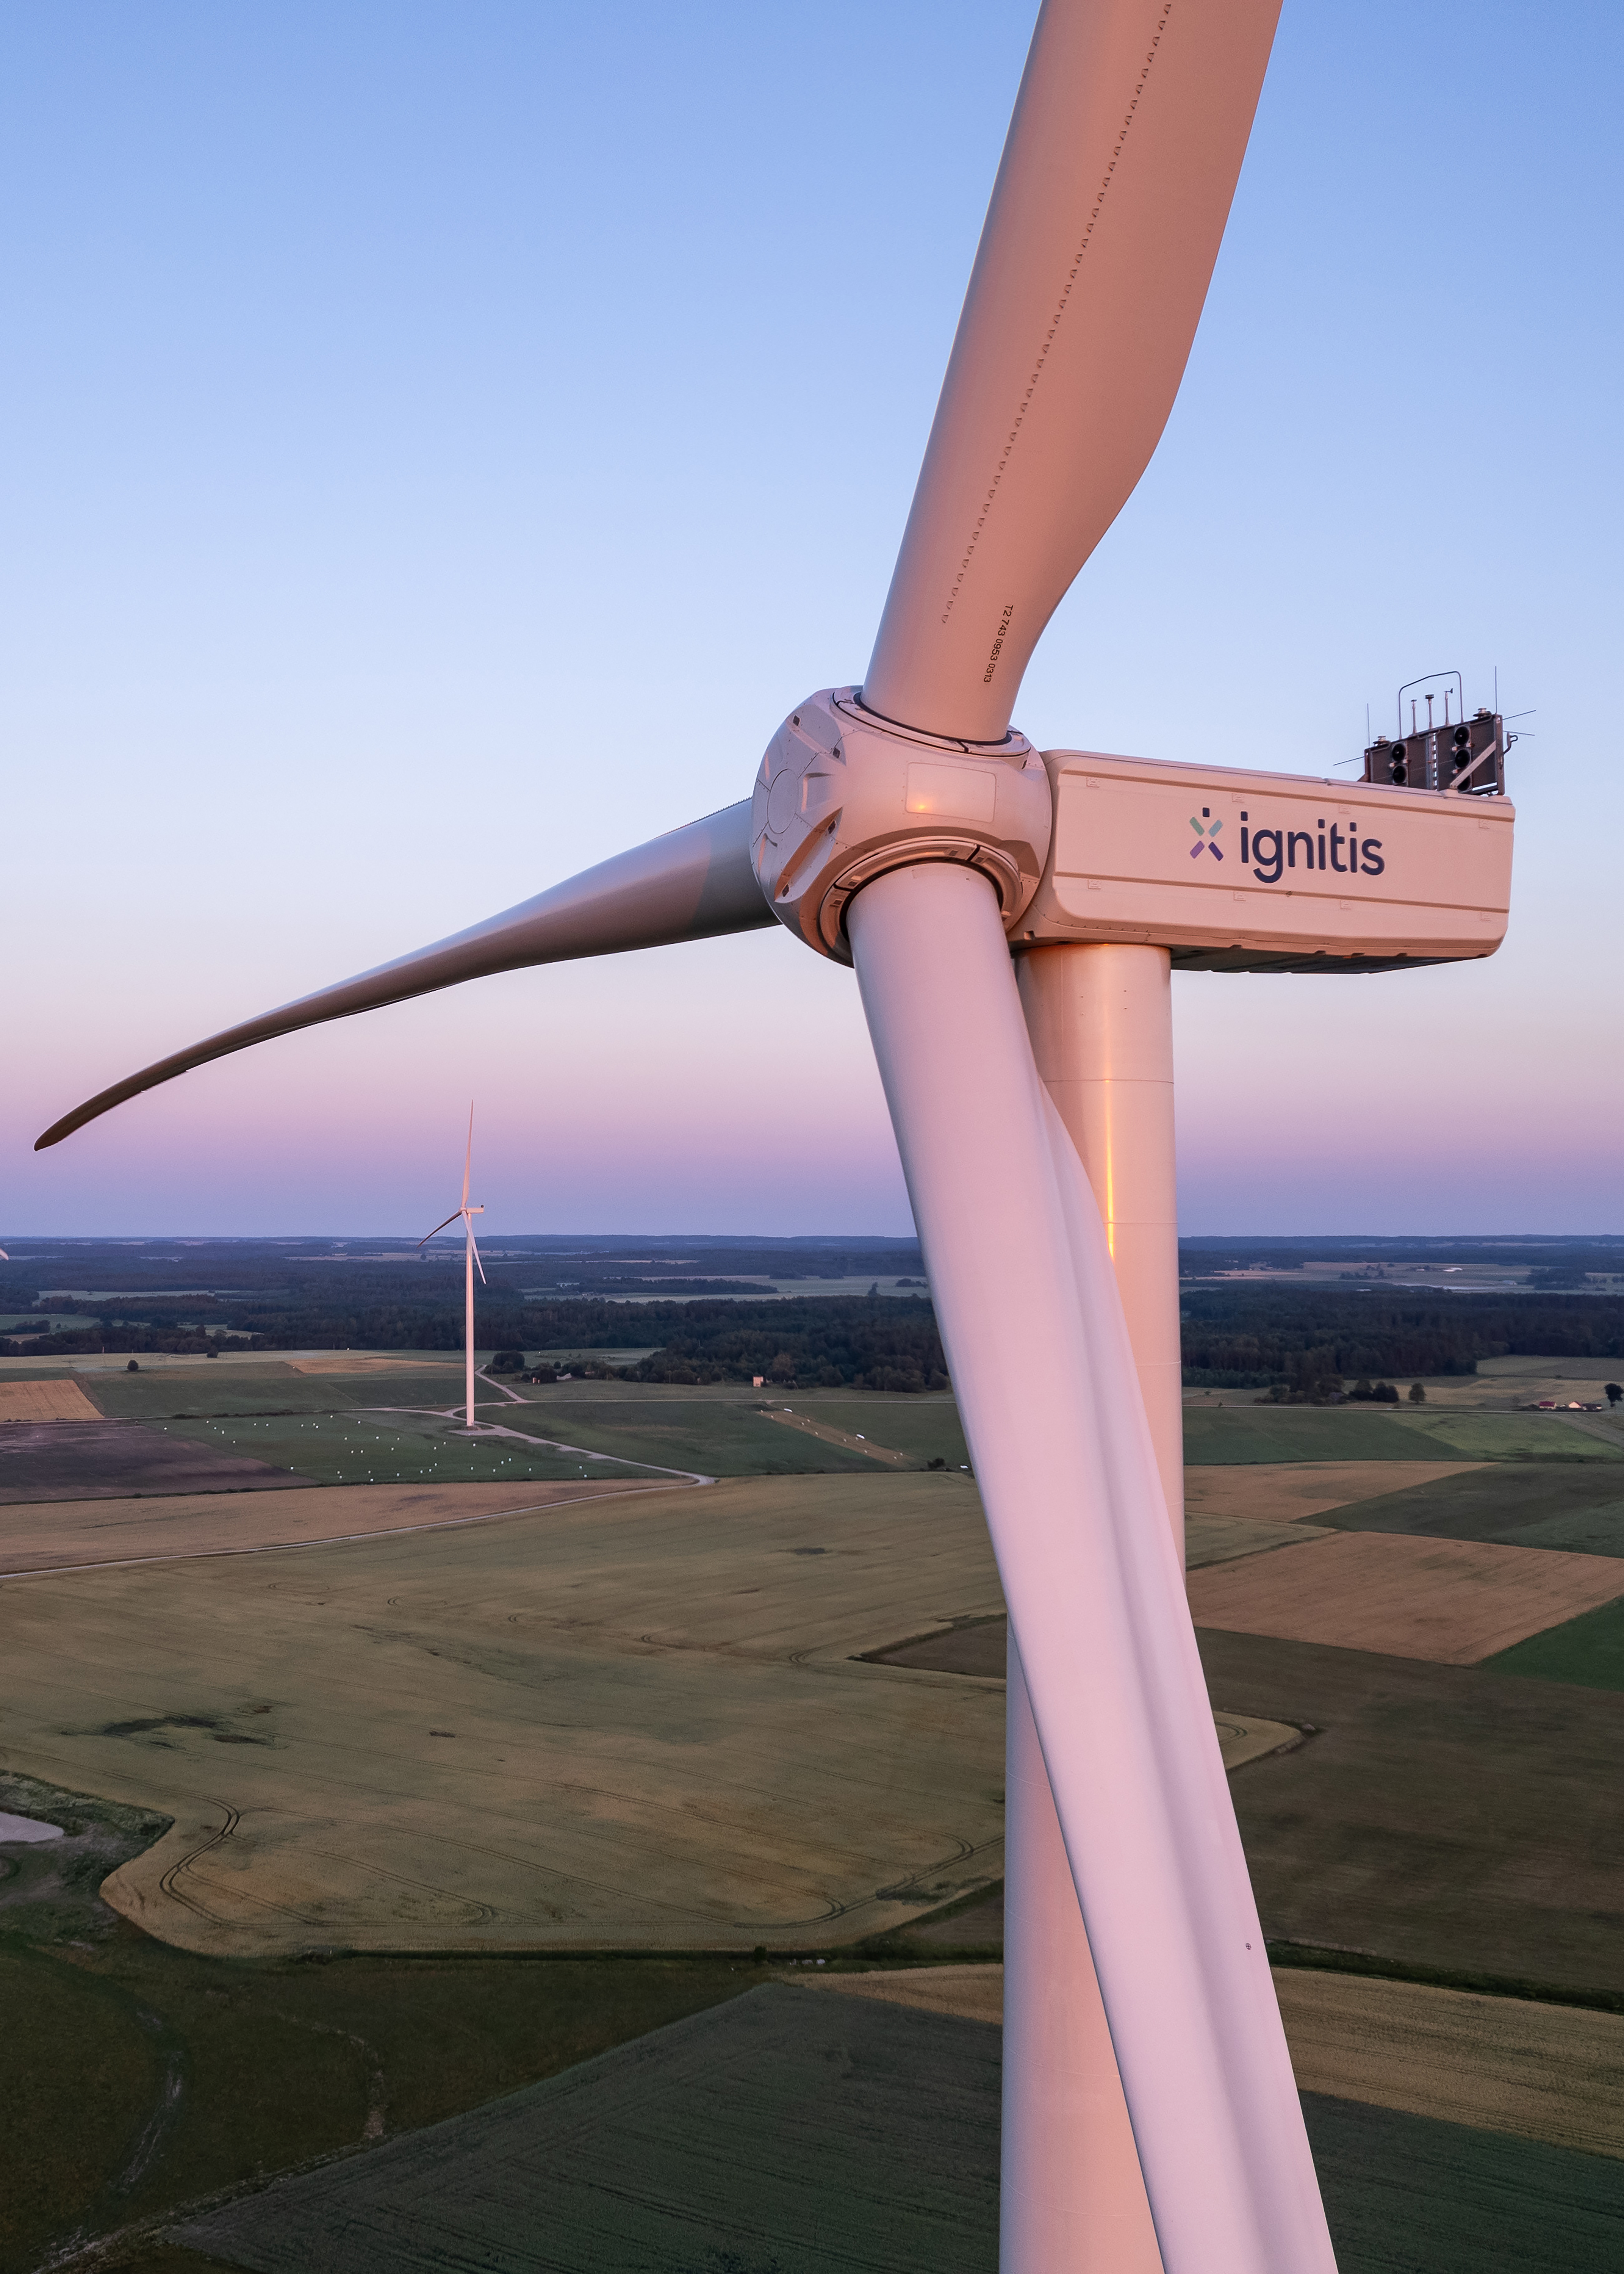
Action for climate
We have committed to being a net-zero bank by 2050. This means our activities across our value chain will result in no net greenhouse gas emissions.
By 2030, NIB aims to achieve its mid-term climate targets with substantial reduction in financed emissions. In this journey, we will work together with our clients across sectors to support the Nordic-Baltic region’s climate neutrality goals.
Nature and biodiversity
We are dedicated to an active work in assessing impacts, opportunities and dependencies on nature within those sectors and operations NIB invests in. We engage with our counterparties and advocate actions to tackle biodiversity loss.
Our approach is twofold: ensuring that our clients address biodiversity issues in an adequate manner as well as understanding the aggregated risks related to NIB’s outstanding loan portfolio.
Responsible investments
As part of our sustainability management, we make sure that the companies we invest in, and transact with, meet our expectations of sound ESG performance. We favour issuers with business models that support sustainable development. More detailed information about our sustainable treasury investments is provided on our website and the latest annual report.

Good governance
NIB is governed by its constituent documents. The Bank’s activities are guided by policies, guidelines and principles. NIB’s governing bodies follow different rules of procedure. Codes of conduct have been adopted to further enhance best governance practices.
Transparency
Transparency and accountability are key for sustainable finance. As an international institution entrusted with public funds, NIB strives to carry out its operations with the highest integrity and in compliance with best practices and its own legal framework.
NIB as a workplace
As a workplace, NIB is built on mutual trust and respect. We promote fair and equal treatment of all our employees and aim for a balanced diversity among our staff. Our community supports inclusion and has zero tolerance on discrimination or harassment.
Managing our carbon footprint
We measure, monitor, report, and manage our internal processes for business travel, energy performance, recycling, waste management, and responsible procurement consistently. What we cannot avoid and reduce, we compensate for.
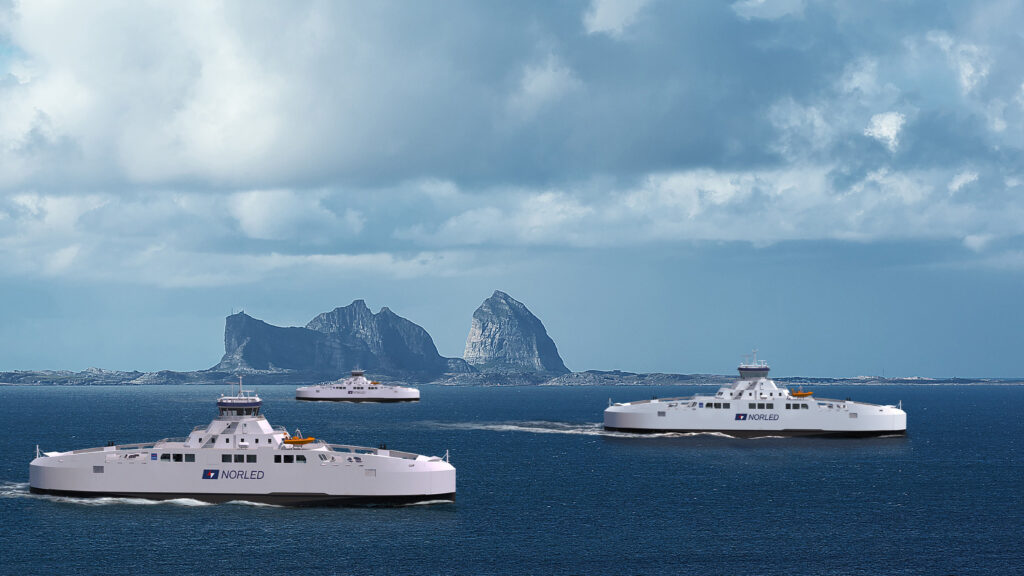
Issuing environmental bonds
NIB Environmental Bonds allow our investors to connect their investments to environmental benefits. Proceeds from these transactions are used to finance projects that support the transition to a low carbon economy.

Latest stories


Reports


Guiding documents
Explore more
About us
We are the international financial institution of the Nordic and Baltic countries.
Project assessment
We assess all our financed projects for productivity gains and environmental benefits.
Cooperation
We cooperate with other financial institutions, and participate in forums to promote sustainable finance.
Corporate responsibility
We follow key principles to further good governance and sustainable development.